
Are you looking for a web analytics platform to replace Google Analytics?
Both Matomo and Mixpanel are great alternatives if you are looking for a tool that is:
- Easy to understand, and
- Powerful enough to give meaningful insights
But which one is more suited to your business model?
Let’s find out how they compare across six different categories, namely:
- Installation and Setup
- Features
- Dashboard
- Integrations
- Support
- Pricing
We’ll also look at one outstanding feature of each tracking tool and give you our two cents’ worth at the end of the article.
Who are they?
Mixpanel’s motto is:
“build better products.”
And that’s what they’ve been helping people do with their data since launching in 2009.
Mixpanel has finetuned its software over the years and is currently one of the most advanced analytics platforms in the world for mobile and web tracking.
Matomo’s (formerly Piwik) motto is:
“To create, as a community, the leading open digital analytics platform that gives every user full control of their data.”
Matomo is an open-source analytics software with privacy protection and user-centric insights. It focuses on web analytics rather than product analytics.
Who will they appeal to?
Mixpanel has been designed for engineering, product, design, and analytics data teams. It focuses on product-based data capturing, allowing the user to see how people interact with a specific product.
They thrive on providing metrics that help businesses convert goals, engage with customers, and, most importantly, focus on user retention.
Matomo, on the other hand, will appeal to companies looking for a cloud or on-premise open-source web analytics solution.
It is intended for marketing and content teams who need to focus on SEO activities without losing control of their user data. It’s suitable for small and large businesses.
One of the most appealing features of Matomo is that their data analysis reports are never sold off; they allow you 100% data ownership.
So, now that you understand these two analytics tools better let’s see how they fare in a head-to-head comparison.
- Installation and Setup
Configuring and setting up Mixpanel is relatively straightforward. Users follow a step-by-step process beginning with registering and signing up for their services.
Once a user understands which metrics he wants to track, setting up the code takes around 30-minutes per event. This is because you’ll write the code for the desired event tracking, verify the data, and then run a stress test to see if it’s working correctly before merging the code with your Data tracking.
Matomo users will need to sign in to their accounts.
Click on Administration, then under Websites/Measurable, click on Manage.
This page is used to create, update and delete websites. Click on Add a new website to create a new site in Matomo.
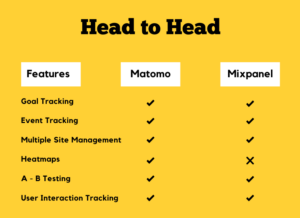
- Features
Analytics platforms have more or less the same features, don’t they?
But not all are necessarily crucial to your business.
Let’s break it down into the most important features and see how they compare:
Created with Canva
- Goal Tracking
Goals help you measure how well your app or site fulfills your target objectives. When an activity is completed, a goal is met.
Examples of Goals are
- Destination Goals
- Duration Goals
- Pages/Screens per session Goals
- Events Goals
Both Matomo and Mixpanel Analytics allow you to set Goals suited to your business objectives.
- Event Tracking
Event tracking helps you identify when a specified event has occurred in your app or business. These events include, but are not limited to,
- Form submissions
- Link Clicks
- Video Plays
- Downloads
Both Matomo and Mixpanel allow you to create custom event tracking, which gives a more focused understanding of how people interact with your website. This is important because companies will each have different events they need to know about.
For example, a music service would want to track a song download as an event, while an eCommerce company would be more interested in a user clicking ‘add to cart.’
- Multiple site Management
When you have different divisions within your business, you need the ability to track multiple pages, websites, or apps with one user account.
Mixpanel and Matomo analytics both allow you to do this.
- Heatmaps
A heat map tool is very handy as it gives you a visual presentation of how your visitors navigate your website.
Use Matomo’s heatmaps to see where a visitor clicked, moved around, scrolled and spent the most time on your website’s pages.
For further reading on Matomo’s Heatmap feature, check out this article which discusses it in more detail.
Unfortunately, Mixpanel does not offer a heatmap tracking feature.
- A – B testing
AB testing is an experiment run to determine which version of a page gets the desired response from users.
For instance, if you notice that people visit a page, but your conversions metrics tell you that they don’t click on the ‘play video’ button, you might want to run an A/B test.
You could then move the play video tab to a different location, edit the font or enlarge the text size. Allow the page to run again and see if your conversion metric increases. If it does, you know that the second version of that page is more successful.
Both of these analytics tools allow you to test different varieties of pages.
- User Interaction Tracking
A Unique feature of Matomo is its content tracking ability.
This software allows you to track how specific pieces of content perform on your website or mobile app.
For example, you might have google ads set as a pop-up on one of your web pages. Have you ever wondered how users interact with that bit of content?
Matomo Content tracking will tell you whether they simply closed it, followed the link, or allowed the ad to play.
A real strength of Mixpanel is its mobile user tracking ability.
It allows you to identify user behavior patterns, such as the likes and dislikes of your individual pages. These metrics help you convert clicks into sales.
Companies that use mobile tracking can improve their product, increase their marketing effectiveness, guide their business, and automate their customer journey.
- Dashboard
A dashboard in Analytics is a collection of the most important metrics you want to track in your business.
Analytical platforms typically allow users to add custom widgets, choosing the data they want to see.
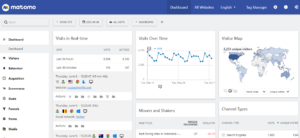
Source: Matomo dashboard
Matomo’s customizable dashboard allows the user to track different metrics about visitors, behavior, goals, and funnels. Users can toggle between these dashboards and view the data in easy-to-understand graphs or charts.
However, the sheer number of different widgets, pop-ups, and boards can overwhelm some users.
Source: Mixpanel Dashboard
Mixpanel keeps dashboards simple and uses various color pallets to display metrics in graphs, tubes, and charts to the user.
Users can choose which widgets to add or remove from their dashboard at any time.
- Integrations
Data integration is often described as the process of combining different data sources into a single unified view. It’s essential for analytics tools to offer integrations as it allows the users to have a more concise view of their metrics across different platforms.
Matomo (formerly Piwik) can integrate with 100+ technologies.
These technology platforms include Content Managing Systems, Online Shops, Forums, and Frameworks.
Mixpanel currently offers more than 50 different integrations in its network.
These include Snowflake, BigQuery, Google Ads, Hubspot and Zoho.
- Support
Nope, we’re not all data analytics scientists.
Not every user of a web analytics platform will be familiar with the software. And not everyone possesses the technical knowledge needed to run their web analytics tool over an extended time.
Everyone needs help. Let’s look at the support you can expect with these tools.
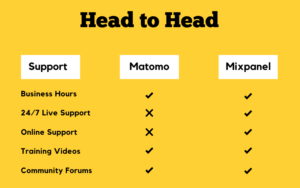
Made with Canva
While Matomo doesn’t offer 24/7 live support, they offer email support for their cloud-based subscriptions and free community support or paid support subscriptions for their on-premise plans.
Mixpanel offers a more extensive scope of support platforms, which might be more attractive to new users of Website Analytics.
- Pricing
Here’s what you can expect to pay for these analytical platforms, assuming you’re expecting around 100,000 hits each month on your site
- Matomo
Matomo has two categories it bases its pricing on.
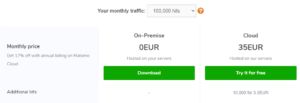
Source: Matomo Pricing
- On-premise:
This is a free plan that you can download and use to track an unlimited number of websites or apps, but you need technical knowledge and a server as it’s self-hosted web analytics.
Advanced features such as Custom reports, Funnels, A/B testing, and Cohorts aren’t included in this plan but are available at an extra fee.
- Cloud
The Cloud plan gives you access to all its features and support needed by you, the user.
The analytics is hosted on their servers.
Cloud hosting also has the added advantage of keeping your software up to date with automatic updates.
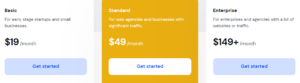
- Mixpanel
Mixpanel’s pricing structure is a bit different. Users can choose from a Free, Growth, or Enterprize plan.

Source: Mixpanel Pricing
- Free
It allows you to track 100k monthly users and gives access to unlimited data history, but users only have limited access to its features.
- Growth
Includes all the features of the free plan. It also has the added benefits of vital tracking ability, such as unlimited saved reports & cohorts, impact reports, data modeling, group Analytics & Data Pipelines add-ons. It also offers email support.
- Enterprise
It gives you access to everything in the growth package but is customizable to your business. The fee is set after a consultation with their sales portal.
Final Thoughts
Your choice of which analytics tool to use boils down to the features you want and the price you’re willing to pay for them.
Mixpanel and Matomo Analytics are both excellent choices when it comes to Website Analytics. Still, their free versions often lack the ability users need to gain a comprehensive understanding of website visitors interact with your pages.
Abralytics is another great platform that helps you understand your audience and measure your marketing without compromising privacy.
They offer customizable dashboards that are simple yet rich with valuable information. Users can add widgets, meaning they can choose which metrics they want to see on their dashboard.
Like the two analytics tools discussed, Abralytics helps you understand how people engage with your website or app across multiple devices.
Abralytics also boasts a very impressive pricing structure, as seen below.
The higher the tier, the more features the platform offers. But noteworthy is the number of websites it can track. Right throughout the pricing structure, abralytics allows you to track an unlimited number of websites. That’s awesome.