Staring at data sheets can be overwhelming to some. Even blurry at times.
We’re not all cut out to sit and stare at a screen, trying to figure out what the most important metrics are and what it all means in the greater scope of things. Thats why I created a simple, GA4 alternative.
But page views by URL is an essential metric that you want to stay on top of. It allows you to see how many views specific pages have received. And the higher your website traffic, the more potential business you’re generating.
Before we get into how you check page views with your Google Analytics account, let’s discuss the difference between page views and unique page views.
What is a Page View in Google Analytics?
Google defines it as “a view of a page on your site that is being tracked by the Analytics tracking code.” (1)
That means that each time a website visitor refreshes or reloads after arriving at the site, the visit is counted as an additional view.
A new pageview is also recorded if the user navigates away from the site and then returns later during the same session.
In simple terms, although your analytics report will show you the number of page views, that won’t necessarily tell you how many individual users have visited your site. Many of these page views could be from one user browsing the internet.
Ok, but how is a Unique Page view different?
“A unique pageview, as seen in the Content Overview report, aggregates pageviews that are generated by the same user during the same session.” (2)
That means if one person views a certain page multiple times during a single session, navigating away and back to that site, Google Analytics will continue to count it as one view in your Analytics Report.
Thus, this is a more accurate way of tracking how many individual visitors have arrived on a particular page.
Why is it important to understand the difference?
As a business or website owner, you want to know how many users navigate your website’s pages. It’ll give you a clear indication if people are happy with your content or if you need to improve your site content to have better user engagement.
To illustrate:
A single user might be loading the same page over and over again, let’s say ten times. This means that he will generate a page view report of 10. But that doesn’t mean you have ten different visitors to your site.
Unique page views are calculated in a completely different way. This means that even if that one user loaded a specific page 10 times, only one unique pageview would be counted.
For this reason, page views will always outnumber unique page views.
It’s important to keep in mind that your page views report in Google Analytics has more to do with measuring internal user behavior on your website than marketing or traffic acquisition.
Understanding visitor behavior, especially with your landing pages, will help you make the needed changes to your website to bring success.
There is also often a direct correlation between user interaction and revenue generated by your business. We can mainly categorize pages into two different categories, content and money.
Content Pages

Source: Pexels.com
As the name suggests, content pages lend users information about topics they are interested in. These are the types of pages visitors land on when researching a subject. An example of this could be a blog post or a product description on your website.
Money Pages

Source: Pexels.com
Money pages are the kind of website pages you can use to sell your product. They have call-to-action tabs embedded and ultimately bring you revenue. Examples of these are Product, Portfolio, and Service Pages.
Show me how to check page views by URL
Firstly, log in to your Google Analytics Account.
On your Analytics Dashboard, navigate to Audience > Overview report
From the Behaviour dropdown bar, select Site Content
Here you’ll have the option of viewing the pages report of a Specific page, a Top-performing page, or All pages on your site.
Select the desired pageviews report and it will pop up. As mentioned at the outset, data can be very complex and leave you scratching your head rather than leaping for joy.
If so, you should consider creating a custom dashboard to display your data and metrics in an easy-to-understand way.
“Google Analytics was too complicated. I save 2 hours every week with Abralytics.”
Create a dashboard
Although tables are helpful, they are often hard to understand in Google Analytics.
Simple visualization helps us gain better insight. Set up a dashboard according to the information you want to understand most from your report in Google Analytics.
If you set it up correctly, the data can be viewable in a single window or historical – Week by week, month by month, and so on.
Too much going on?
It’s often said that there is beauty in simplicity.
Most people don’t want to sit and figure out how to view their own website traffic in complicated reports, let alone create a custom dashboard themselves.
So, here’s a top tip:
Abralytics has always been keen on simplifying things for the everyday user. And their approach to page views is no different.
Apart from giving you a custom report, they set it up in an easy-to-understand way that displays Total page Views / Unique Visitors and Average Session Length, as seen below.

Screenshot: Abralytics.com/demo
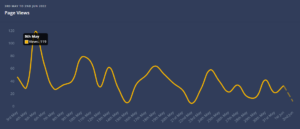
If you’re interested in slightly more in-depth reporting, showing on which days you generated the most traffic, you’ll have this custom dashboard available for viewing:
 Screenshot: Abralytics.com/demo
So why not look at Abralytics as a real alternative to Google Analytics. Affordability and simplicity are perfectly balanced to give you the ultimate performance metrics in an understandable way.
The other major pro is that Abralytics updates instantly whereas Google Analytics can take up to 24 hours.
Click here for a free trial and let Abralytics do the work for you.
Sources:
1 – Google Support
If you liked this article, check out our in-depth guide to the pros and cons of Google Analytics.


