
Understanding the average time a user spends on your website helps you see which pages convert better and which content they engage with the most.
But how do you measure how long someone stays on a website?
If this subject has piqued your interest, then read on.
This article covers everything you should know, including:
- How to track the average time metrics
- What is the average session duration and how to improve it
- What is the average time on page and how to improve it
- What is the average time you should aim for?
How Long Does A User Stay On Your Website?
You can measure how long a user stays on your website by tracking these two metrics – session duration and time on page.
1. Session Duration
 Source: ppcexpo.com
Session duration, also time on site, is the total time someone spends on your website in a single session.
But, what is a session in Google Analytics?
A session is a group of user interactions noted during a specific time frame.
After 30 minutes of inactivity, when the user exits, or at midnight a Google Analytics session expires. And it starts when a user accesses a page on your website.
What Is Average Session Duration?
Average session duration is the average time spent on your website by all users.
Remember that if a user visits your website multiple times over several days or continues their activity on a web page later, they may have multiple sessions.
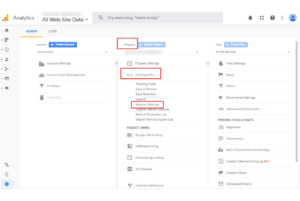
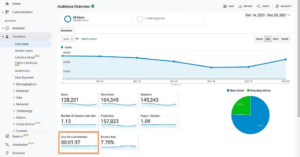
In Google Analytics, go to Audience > Overview to see the average session duration of your website.
Source: hubspot.com
How does Google Analytics Calculate Session Duration & Average Session Duration?
- For Session Duration
Google Analytics calculates session duration by noting the timestamps of when a visitor arrives on your landing page (via a search engine or any other channel) and when they leave your website.
For example:
- The session duration of a user that spends 5 minutes on your site before exiting is recorded as 5 minutes.
- Suppose the same visitor spends extra 7 minutes on another page of your site. The session duration is 12 minutes.
- For Average Session Duration
It is calculated by dividing the sum of all session durations by the total number of sessions in the same period.
For example, four website visitors have session durations as follows:
- Visitor 1 spent 100 seconds on your website.
- Visitor 2 spent 80 seconds on your website.
- Visitor 3 spent 160 seconds on your website.
- Visitor 4 spent 60 seconds on your website.
Google Analytics would add these session durations (100+80+160+60=400) and divide the total (400) by the number of sessions (4) to determine your average session duration. The total is 100 seconds, or 1 minute and 40 seconds. In addition, Analytics may display this as 00:01:40.
Are Session Duration And Dwell Time The Same?
No, these metrics are certainly not the same! Here is why:
Dwell time measures how long a person stays on a single page after clicking on a search result.
Google Analytics calculates the dwell time using timestamps that track a user’s actions from the moment they click a link from a search engine until they return to their search results.
On the other hand, session duration is the total time your website visitors spend in one session.
Note that sessions do not include time spent on exit or bounce pages. So even if a visitor spends a few minutes reviewing a page before leaving, their visit won’t be counted as part of their total time.
Does Session Duration Affect Your Website’s Search Engine Ranking?
Yes, session duration, or time on site, affects your site’s ranking on a search engine!
A good average session duration tells Google that your site’s information is engaging and valuable to users. It suggests that the content you’re putting out deserves the first-page position in search because it gives users what they want.
How To Use Session Duration In Google Analytics

Source: Pexels
When checking your on-site time metrics, remember that they cannot answer all your questions on user behavior and how they interact with your content.
Simply telling you that most people spend three minutes on your website, for example, does not give crucial insights.
The metric does not indicate the specifics!
For instance – users didn’t like the content, the page took too long to load, they were annoyed by the adverts, or the next steps weren’t clear.
You can do the following to make the most of the session duration metric.
First, segment the users into cohorts depending on their session durations. With this, you can see how well you are guiding visitors on how to move down the conversion funnel.
If you see that many users follow the conversion funnel faster than you expected, it can mean they bypass some crucial processes or have found a shortcut.
Alternately, if you find that more people are spending more time on a particular page of your website than planned, there could be something confusing that is making it take longer for customers to navigate.
“Google Analytics was too complicated. I save 2 hours every week with Abralytics.”

How To Improve Your Website’s Session Duration
Here are some strategies that can help to improve the session duration of your website:
- Publish High-Quality Content
Make sure to capture and hold your readers’ attention no matter what content you use on your website.
And choose a voice that accurately describes your business and information that will interest your audience.
For example, you can include pages that tell users where your products are made and how to use the products on your website.
- Include Relevant Keywords
Even if your website has excellent content, it won’t matter if the target audience cannot find it. Using the right keywords impacts your position in search and, therefore, your visibility.
So, it’s essential to use relevant keywords to your business niche for the right audience to find and interact with your website.
- Optimize Your Site Loading Speed
Slow site speeds are one of the main reasons for high bounce rates and short dwell times.
People expect websites to load quickly. With every second they wait for your content to load, the chances of them leaving increases.
The good news is that you can optimize your site’s speed by – limiting the use of complex images, fonts, or formatting.
- Use Internal Links
An internal link helps users navigate from one page of your website to another page.
For example, if you write a blog about a product feature, include a link to the product description page. This way, they can easily find the product you’re discussing.
2. Time On Page
Source: help.analyticsedge.com
What Is Average Time On Page?
Average time on page is the average time a website visitor spends on each page of a website. So, the metrics show much time is spent per page on a website.
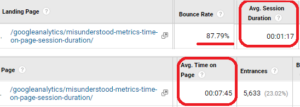
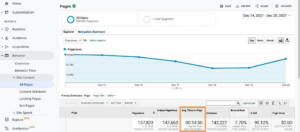
In Google Analytics, navigate to Behavior > Overview to see the average time on page report.
Source: hubspot.com
How Google Analytics Calculates Time On Page & Average Time On Page
Here is how Google Analytics measures the time on page and average time on page metrics:
- For Time On Page
Google Analytics counts the time spent on each page to calculate the time on page metric.
For example:
- If someone reads a blog article for five minutes, that counts as one.
- It becomes two when the same user clicks through to another page on your site.
- The timestamp is zero if a user exits your site without clicking through to another page.
- For Average Time On Page
Google Analytics calculates the average time on a page by tracking the difference between the timestamps of hits.
It’s the time it takes from when a visitor lands on a page till they move to the next one.
However, a user’s visit is not recorded if they open only one page and immediately close their browser or put another URL into their address bar.
Average time on page = total time on page (in seconds) / total number of page views (minus the number of exits)
For example, the average time on page for a page with 1,500 page views, 1,000 page exits, and 300 minutes of time spent on the page is :
300 / (1500-1000) = 0.6 minutes or 36 seconds
Time On Page Vs. PageViews
Time on page may increase as websites get more engaging. For instance, a site visitor may be able to click a button to browse portfolio items or galleries without leaving the current page or launch a lightbox with more material on the same page.
Therefore, the time on page metric would be more crucial rather than counting the overall number of page views.
Why Is Average Time On Page Higher Than Average Session Duration?
Time on page does not include bounces and exits in its measurement. So, the average time calculation is higher.
On the other hand, the average session time starts each of these sessions as zero seconds and includes all bounced traffic – about 50% of the total traffic.
How To Use Average Time On Page In Google Analytics

Source: Pexels
Once you know how long your visitor generally spends on a page, the next step is to examine the report and identify areas for improvement.
But remember that a good average time on page depends on many factors.
A survey from Contentsquare reveals that, across all industries, a visitor’s average time spent on a website is 54 seconds. (1)
You may compare your website’s metric with this standard for an idea of your website’s performance.
A short time on a page could mean your website is not performing well. For example, your site’s content may be unrelated to the search phrases it ranks for. Consequently, visitors are likely to be perplexed and leave too quickly.
Of course, a long time on a page is a good thing.
However, if visitors spend so much time on a page without completing the activities you want them to do, such as buying a product, completing a contact form, or subscribing to your newsletter—you could have problems.
How To Improve Your Website’s Time On Page
Here are some techniques that can help to improve the time on page metric of your website:
- Add Videos To Your Site
Including videos on your website can keep visitors there longer because it’s simpler to watch a clip than to read a lengthy piece of text.
You increase the chance visitors will discover a fun way to interact with and stay on your website when you provide both options.
Here are examples of some types of videos to include on your site:
- DIY tutorials on how to use your products.
- A peek at your production process from behind the scenes.
- An interview with a satisfied client.
- Ensure Your Content Is Readable
Visitors are less likely to stay around if your pages are challenging to read, especially on mobile devices.
Use fonts large enough for people to read and break long bodies of text with subheadings and media.
- Optimize Your Website’s Performance
According to research by Hobo, 40% of your viewers will quit within three seconds and search elsewhere to find what they’re looking for if your website loads too slowly. (2)
Therefore, optimizing your site’s performance is crucial to improving the average time on page metric.
- Make Sure Your Site Is Easy To Navigate
If your website is challenging to navigate, you can expect that most visitors will become frustrated and leave. While this depends on your site and niche, here are a few ways to improve navigation:
- Remove redundant fields from the contact form and checkout pages.
- Sort blog posts and products for easy navigation.
- Avoid using misleading pop-ups.
Final Verdict

Source: Pexels
In a nutshell, tracking how long someone stays on a website is crucial. With this information, you can determine if site visitors are passing by quickly or whether they’re staying a bit longer and reading your content to carry out the target action – a conversion.
We have discussed the two essential metrics that can help extensively measure the average time spent on your website in this article – session duration and time on page.
When next you check your web analytics report, ensure to give them premium focus!
If you found this article helpful, check out similar articles on Abralytics.
Other related articles
- How To Measure Website Traffic
- 10 Most important Google Analytics metrics
- How To Delete Goals In Google Analytics
Article Sources:
2 – https://www.hobo-web.co.uk