No two data analytics tools are equal. Before making potentially costly decisions, you need to ensure you’ve found an analytics solution that is right for your company.
There are some critical factors to consider. The analytics solution must:
- Match your business objectives
- Be cost-effective relative to your business size
- Support mutual integration with other tools in your Martech stack
- Offer advanced analytics features, if needed
- Have an intuitive user interface, and
- Be data privacy compliant.
Read on if you are looking for a top-notch tool and want an in-depth Mixpanel vs. Google Analytics comparison before making up your mind.
This article covers their comparative advantages, core differences and which is the best tool for your business.
What Is Mixpanel?
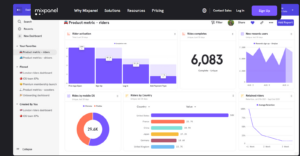
Source: Mixpanel Homepage
Mixpanel helps track a visitor’s interaction with your digital properties, such as web and mobile applications. With this, you can analyze user behavior and enhance your app’s features and user experience.
Some of the services provided by Mixpanel are creating user survey forms and in-app A/B tests. Unique visitors and customer reports can be created based on this data to monitor user interaction and retention.
Some of the core features of Mixpanel are:
- Custom Alerts and iOS Apps
- Data Reporting and Synchronization
- Funnel Visualization
- Impact Report Generation
- Segmentation and Group Analytics
What Is Google Analytics?
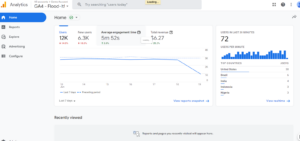
Source: GA Dashboard
Google Analytics (GA) is the most widely used web analytics tool for collecting user data.
Essentially, GA lets you:
- find out where your website gets the most visitors,
- evaluate the success of your marketing efforts and campaigns,
- discover patterns and trends in user interactions, and
- collect user data like gender and demographics.
The Core Similarities Between Mixpanel And Google Analytics
- Data Visualization
Mixpanel and Google Analytics can help you create dashboards for tracking changes in traffic, conversions, funnels, segment trends, and other data visualization metrics.
- Funnel Tracking
Both Mixpanel and Google Analytics feature funnel analysis.
Funnel analysis helps to track users in a funnel-based model. It tells you how many users make it through each phase of the funnel while also showing problems and areas of improvement for better conversion.
Mixpanel funnels allow you to change data, show how users interacted with your website and segment reports based on your audience. Google Analytics enables you to collect data via multi-channel funnels.
- Free & Paid Versions
Both Mixpanel and GA have free and paid versions. Mixpanel has three plans – Free, Growth, and Enterprise. On the other hand, Google Analytics has two versions – Free and Google Analytics 360.
- Mobile & Web Application Tracking
Google Analytics and Mixpanel have an event-based model for tracking users across mobile and web applications. So, you have total coverage for your audience in all your digital properties.

Source: Pexels
- Cloud Hosting
Hosting of both Mixpanel and Google Analytics is on their cloud servers. Hence, you don’t have to worry about hosting analytics remotely on your server.
- Data Reporting
Both tools report analytics data from your digital properties. With Google Analytics, you can obtain the audience, advertising, and acquisition reports. Meanwhile, you can get product analytics reports from Mixpanel.
The Core Differences Between Mixpanel And Google Analytics
1. Pricing Plans
Mixpanel
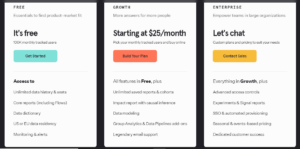
Mixpanel has three versions – Free, Growth, and Enterprise.
Free:
As you can guess, this version of Mixpanel costs $0. It is the most basic and has limited features compared with the other plans. With it, you can track a hundred thousand users at most.
Meanwhile, it offers unrestricted data history & seats, a data dictionary, core reports (including Flows), US or EU data residency, monitoring, and alerts.
This plan is suitable for small businesses that don’t require many advanced analytics features.
Growth:
The Growth plan begins at $25/month. The actual price you’ll pay for the service depends on your monthly traffic and other advanced features.
Growth offers everything the Free plan has plus some additional features, including:
- unlimited saved reports & cohorts,
- impact reports with causal inference,
- data modeling, etc.
If you have a small or medium-sized business that requires some more features than the free version offers, this plan may be the perfect fit for you.
Enterprise:
The Enterprise plan is custom-based. So, the actual price you’ll pay for the service depends on how you use the analytics tool. Essentially, the number of monthly tracked users and the advanced features used determine the monthly cost.
This plan includes all features under the Free and Growth plan feature plus some additional tools:
- advanced access control,
- experiment & signal reports,
- SSO & automated provisioning, etc.
This plan is suitable for large enterprises that require many advanced features and have a large amount of monthly traffic.
Source: Mixpanel
Google Analytics
Google Analytics has two models – Free and Paid (Google Analytics 360)
Free: Universal GA or GA4
You’ll need to set up a Google Analytics account to access the free plan. The free plan offers real-time data, personalized reports, and advanced segmentation, allowing you to monitor your users and how they engage with your websites. And app tracking and mobile device features help monitor user behavior on mobile apps.
The free version of GA offers tons of metrics that provide more than enough data for most small to medium-sized businesses.
Paid: Google Analytics 360
According to OptimizeSmart, the premium version of Google Analytics, also known as Google Analytics 360, starts at $150,000 per year with a service level agreement.
Compared to the freemium version of Google Analytics, the paid version offers better data quality, enhanced data freshness (98 percent, according to whatagraph.com), and higher data accuracy.
Also included in the premium version are data-driven features, attribution modeling, double-click manager integration, and data processed through Google Big Query.
Verdict On Pricing Model
Though Mixpanel offers better flexibility with the three pricing models (Free, Growth, and Enterprise), Google Analytics has a freemium version (standard Google Analytics) and a premium version (Google Analytics 360).
Overall, Google Analytics wins because you can access powerful analytics data, even at no cost!
2. Server Call Limits (Data Limits)
Mixpanel
Both Free and Growth plans have the same server call and data limits as follows:
- Monthly tracked users: at most 100k users.
- Event limit: equivalent to a maximum of 100 million events.
Here are the data limits on the Enterprise plan:
- Monthly tracked users: custom based but more than 100k users.
- Event limit: custom based but more than 100 million events.
Google Analytics
Google Analytics provides up to 10 million monthly hits for the standard version (free). Also, you have up to 20 custom dimensions and metrics.
However, Google Analytics 360 (premium) lets you get up to 1 billion+ monthly hits. There is a maximum of 200 custom dimensions and metrics. If you want more, you can create a customized plan.
Verdict On Data Limits
Here, Google Analytics takes the crown! Even with the standard Google Analytics version, you can be sure of up to 10 million monthly hits.
3. User Tracking
Mixpanel
When a user lands on your website pages, anonymous data is linked to the user to enable tracking. With this, you may keep tabs on every user action, from the get-go to the post-login activities. For user tracking across platforms and devices, the same method applies.
In Mixpanel, to identify users for cross-device tracking, you must generate a user ID. Besides, the analytics tool lasts longer than Google Analytics because it has a method of identifying users without using cookie values (anonymous tracking).

Source: Pexels
Google Analytics
For first-time website visitors, Google Analytics creates a unique ID using cookies. But the Google Analytics ID is not device-agnostic. To track users across devices, you must provide each user with your client ID.
Since Google Analytics uses cookies, they determine how long tracking lasts. For example, if a person returns to your website after clearing the cookies in their browser, they will be considered a new user.
You can assign your client ID to make the most of user tracking, but you cannot utilize Personal Identifiable Information (PII), such as phone number and email address, to identify users.
Verdict On User Tracking
When it comes to the user tracking feature of both digital analytics tools, there is a tie! So, the choice depends solely on your needs.
Google Analytics is the top tool if you must track users across many domains.
However, Mixpanel wears the crown if you want to receive the most accurate data since it doesn’t use cookies for user tracking. Generally, needing to ask for consent to use cookies reduces the accuracy of GA results.
4. Use Cases
Mixpanel
Product teams looking to understand the behavior of their users should use Mixpanel. It covers businesses in the software, e-commerce, and media industries. If you want to know how customers interact with a digital product you have, Mixpanel is for you.
Mixpanel uses an event-tracking model – a flexible method of data collection. Then, you may create reports like funnels to see how much time has passed between processes.
If your website is “simple” and has few user interactions, Mixpanel may be overkill.
Google Analytics
Google Analytics. It is a vital tool with many uses, even at no charge. Most of the data you’ll need is readily available on Google Analytics, based on a pageview model.
Besides, Google Analytics can be used to keep track of events. Google has been putting a lot of effort into creating new reports, like cohort analysis, better funnels, and tracking users by ID (rather than anonymously).
Overall, Google Analytics is excellent for identifying the source of visitors (marketing attribution) and may be especially helpful for “simple” websites with few user interactions. Informational websites, blogs, and e-commerce websites all fall under this category.
Mixpanel: Pros And Cons
- Pros Of Mixpanel
Simple Funnel Visualization
A funnel is one of the simplest methods to depict user journeys. Google Analytics and Mixpanel provide funnel visualization, but Mixpanel’s method is far more user-friendly.
By defining the user journey’s steps, you can set up a Mixpanel funnel. These could be a user action, web pages they visit, or other pertinent information.
Functional Insights
All data collection efforts will be for nothing if you don’t act on the information. Based on the data you’ve collected, Mixpanel enables you to test hypotheses.
You can test your product, modify your messaging, and tweak your offering to appeal to various user groups.
- Cons Of Mixpanel
Complex User Interface
Mixpanel’s user interface is not beginner-friendly. Many users agree that it takes some time to get used to how the analytics tool works.
Although Google Analytics might be challenging when you start, it is a better option if you want to get going as soon as possible.
Limited Attribution Model
Although Mixpanel tracks attribution channels, it is not as effective as Google Analytics. A seamless and complete connection is possible by pulling Google Ads data into Google Analytics.
Google Analytics: Pros And Cons
- Pros Of Google Analytics
Effective Attribution Model
Compared to other tools, Google Analytics attribution models are the most accurate. Moreover, it allows multi-channel funnels.
Meanwhile, you have a lookback window of 30, 60, or 90 days with Google Analytics and several attribution models based on the marketing channel dimensions.
Simple Installation
The installation process of Google Analytics is simple.
You may opt to install tag.js (Global Site tag), analytics.js (Google Analytics tag), and Google Tag Manager’s automated integration method.
In addition, Google Analytics Help Center provides step-by-step guides for Google Analytics implementation.
- Cons Of Google Analytics
Complex Analytics

Source: Pexels
Google Analytics is a complex analytics tool because of its infrastructure. It offers more than most businesses need. The dashboard is quite complicated, especially for new users.
If you’re looking for a simple analytics tool, opt for Abralytics – a Google Analytics alternative that can cater to users with any level of technical skills.
Large Script Size
Google Analytics is built with heavy Javascript code. For context, gtag.js weighs 28KB, while analytics.js weighs 17.7KB. These two tracking scripts add 45.7KB to your site’s pages!
Ultimately, large script sizes slow down your website.
Final Verdict
Both Google Analytics and Mixpanel have their pros and cons. So you should opt for the analytics tool that perfectly fits your business goals and objectives.
We’ve placed two top analytics tools side by side in this article and carried out a detailed Mixpanel Vs. Google Analytics comparison. Of course, both analytics tools have their respective ups and downs.
If you found this article helpful, check out similar Analytics articles.
Other related articles

