
There are over a hundred metrics that you can look up on Google Analytics to get an idea of how well your website is performing.
While it’s impossible to keep an eye on all of them, you must pay attention to the crucial ones.
But what are the most important KPIs (Key Performance Indicators) to track on Google Analytics?
Read on as we get you through everything you need about them, including:
- What are KPIs?
- What are the 5 most critical KPIs to track?
- How can you improve each KPI?
- FAQs
What Are Google Analytics KPIs?
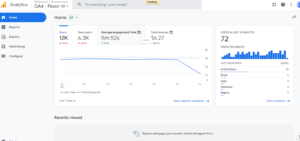
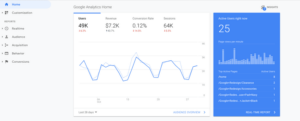
Source: Google Analytics Dashboard
Google Analytics KPIs are metrics that tell us about a website’s performance. They help monitor and analyze your visitors’ actions and give critical insights into what works and what doesn’t on your site.
As a digital marketer, Google Analytics KPIs can show you the part of your marketing funnel that needs tweaking for better conversion.
They include Bounce Rate, Number of Sessions and Users, Pageview & Unique Pageview, Pages per Session, Organic vs. Paid Session, Cost Per Acquisition, Top Landing Pages, etc.
Top 5 Most Important Google Analytics KPIs
1. Bounce Rate
Source: hotjar.com
Do you want to know if your website meets the needs of its users? Or how many users leave your landing pages without engaging your content further?
One excellent way to do this is to check your bounce rate.
What Is A Bounce?
A bounce occurs when a website visitor lands on a page and does nothing else before exiting.
That is, the website user does not trigger any request to the Google Analytics server before leaving the page.
A bounce is also known as a single-page session.
For example, when a new user visits your website homepage from a search engine and does nothing else like click on an internal link or interact with your content significantly before they exit. Then, you can say the user ‘bounced’ from your website.
What Is Bounce Rate in Google Analytics?
The bounce rate in Google Analytics indicates the number of sessions that result in a bounce. In other words, it tells you how many sessions start and end on the same page.
How To Calculate Bounce Rate For A Website And Web Pages
The bounce rate for a website is the ratio of the number of single-page sessions (bounces) to the total number of sessions.
Website Bounce Rate = the number of single-page sessions (bounces)/ total number of sessions.
For example, if your website has 100 sessions in total and the number of single-page sessions is 10. Then, the bounce rate for your website is 10%.
For a page, the same rule applies. But let’s define the bounce rate for a page.
The bounce rate for a page is the ratio of the number of single-page sessions (bounces) that start and end on the page to the total number of sessions that continue from the page.
Page Bounce Rate = the number of single-page sessions (bounces) on the page/ total number of sessions starting from the page.
Is the Bounce Rate the same as the Exit Rate?
No, while bounce rate measures ONLY single-page sessions, exit rate covers how often visitors exit after viewing any number of pages.
Why Is Bounce Rate Important?
Bounce rate helps you understand how users interact with the individual pages on your website so you can make better marketing decisions and decide which pages to optimize.
Moreover, bounce rate provides information about your landing page to determine if you need to invest resources on a new page or optimize your existing page for a better user experience.
Also, bounce rate by any browser is another key metric that tells you how your website behaves on various browsers. If your website has an issue with a browser version, it will affect your overall conversion rate and the time users spend on your page.
How To Reduce Your Bounce Rate
In Google Analytics, a high bounce rate does not necessarily mean your website is not doing great. However, here are some measures to take to reduce your website’s bounce rate:
- Improved Page Load Time
The page load time of your website is key to determining if a user will stay on your website or leave without interacting with your content.
For example, if a website visitor has to wait for too long (more than three seconds) before viewing your content, there is a high chance of bouncing due to a poor user experience.
- Make Navigation Easy
Visitors should be able to navigate the site easily.
There should be a sense of direction in the organization of the pages of your website and the contents. Have a simple navigation menu, an internal search function and create a site map for your visitors.
2. Goal Conversion Rate
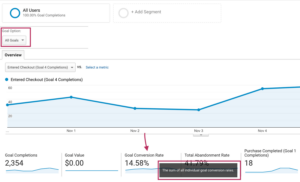
Source: hotjar.com
Do users carry out the desired target action? Are you wondering why some users do and others don’t?
You can find the answers to these questions with the goal conversion rate. First, let’s define goals, goal conversion, and goal conversion rate.
What Are Goals?
Goals are target actions you intend for your website visitors, like sign-ups, purchases, adds-to cart, etc. Hence, every website must have one or more clearly defined goals.
What Is Goal Conversion?
Goal conversion, on the other hand, occurs when your web users carry out the desired target actions. That is, it happens when your visitors complete a goal. For example, when they sign up for a newsletter, purchase, add a product to a cart, etc.
What Is Goal Conversion Rate?
Goal conversion rate is the ratio of the number of completed goals (goal conversion) to the total number of sessions in percentage. The goal conversion rate tells you the number of completed target actions by your website visitors.
How to Calculate Goal Conversion Rate
In Google Analytics, to obtain your website goal conversion rate, you divide the number of goal conversions by the total number of sessions times 100.
For example, if your website goal is newsletter sign-ups, every time a user signs up, it will count as a goal conversion. So, if you have 150 sessions and 30 sign-ups, the goal conversion rate of your website is 20%.
Why Is Goal Conversion Rate Important?
It is crucial to track the goal conversion rate of your website because it tells you how well your website is performing in the desired areas.
For eCommerce websites, a general goal to track is purchases completed. It helps you identify trends and find opportunities to increase sales.
How To Increase Your Goal Conversion Rate
As previously stated, a high goal conversion rate is desirable. So, here are some measures you can take to increase your goal conversion rate:
- Track Your Bounce Rate
As discussed, the bounce rate of your website plays a significant role in achieving your website’s goals.
The longer a visitor spends on your site, the greater the chances they’ll convert. Simple.
- Understand User Behavior
A clear understanding of visitor behavior helps you meet their needs better and ultimately increase your goal conversion rate.
To do so, you can use tools like “Shopping Behavior Analysis” in Google Analytics.
3. Landing Pages
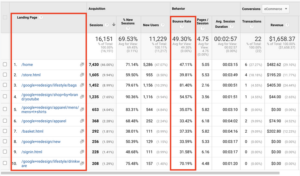
Source: omisdo.com
What Is A Landing Page In Google Analytics?
A landing page is the first page users see as they visit your website. So, it could be your homepage, a blog post, about product page, a sign-up page, or anything else.
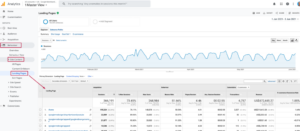
In Google Analytics, the landing page report shows the traffic data about the first page of a user’s session.
What Key Metrics Are In The Landing Pages Report?
Here are the most important metrics to keep an eye out for:
- New Users: the number of first-time visitors on your landing page who have never interacted with your website.
- Sessions: the total number of sessions originating from a particular landing page.
- Average Session Duration: the average time users spend on your website per session.
- Bounce rate: is the ratio of the number of bounces to the total number of sessions in percentage.
- Average Pages per Session: the total number of pages a user visits in each website session.
Why Are Landing Pages Important?
Your website’s landing page goes a long way in determining whether users will leave or proceed to another page of your website and how well your website ranks on organic search results of search engines.
With the insights from the Landing page report, you can determine if you need to create or optimize other landing pages for a better result.
How To Improve Your Landing Pages
To improve your landing pages, here are some techniques you can employ:
- Know Your Users
Good knowledge of your users is pivotal to delivering value to them. So, you need to pay attention to user demographics – age, gender, and interests, to mention a few. Then tailor your content, images and text to appeal to them.
- Create engaging copy
Copywriting is fundamental to web analytics and plays a vital role in the quality of your landing pages and, ultimately, your overall website performance. Take the time to craft a strong headline, highlight the benefits of a product/service and include customer testimonials.
4. New and Returning Users
Source: hotjar.com
Do you want to know if your website has new visitors, which of your marketing channels they came from, or if an existing user checks out your website again?
The New and Returning Users metric can provide you with relevant answers.
What Are New Users vs. Returning Users?
New users are those who are visiting your website for the first time. Conversely, returning users are visitors that have been on your website before.
But, how does Google Analytics differentiate both user types? Let’s look at this briefly.
Google Analytics uses a tool called Google Tracking Snippet to check for a tracking code (cookie) on a user’s device when they visit your website.
For new users, the cookie will be absent. However, for a returning user, the cookie will be present.
Note: Every user in Private/Incognito browsing mode is counted as a New User by Google.
Also, Google counts returning users who have not visited your website in two years as old users. Hence, the metric may not be 100% accurate.
Why Are New Users vs. Returning Users Important?
For example, a person with a blog will be interested in how many people return to read their new content. Based on this info, they could decide to spend more time marketing their new stuff.
An e-commerce store will be interested in the percentage of visitors who are there for the first time and those who are repeat customers. A high number of returning customers tells you that people are happy with your service and the products they buy. If the percentage of new visitors is low, it is time to ramp up your marketing efforts using tools like Google ads, Facebook ads, etc.
How To Increase Your Returning Visitor Rate?
Here are some strategies you can use to increase your returning visitors rate:
- Create an Email Newsletter
Emails are a great medium to keep in touch with your users and get them to return to your website.
So, if you do not have an email list of your users, there is no better time to create one than now.
- Use Social Media
Social Media is a great tool for boosting your website traffic. Depending on your product or service, you can choose the platform best suited to you. And then regularly post about new products, services or articles that you’ve posted on your site.
5. Average Time On Page
Source: help.analyticsedge.com
Do you wonder how long users spend on a page of your website? Or do you want to know if users find your website content intriguing?
The answers to these questions are in the users’ average time on the page.
Let’s start by defining the term average time on the page.
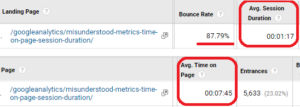
In Google Analytics, the average time on a page measures the time users spend interacting with the website content per page.
Mathematically, it is the ratio of the total duration of all sessions (in seconds) to the total number of sessions.
Average time on page = total duration of all sessions (in seconds) on the page/ total number of sessions
The average time on your page is not the same as your average session duration.
While average time on page tracks only non-exits and non-bounce sessions, average session duration includes bounces and exit pages in its report.
Why Is Average Time On Page Important?
Average time on page is crucial to your analytics because it helps you see the pages of your websites that users interact with or otherwise based on the time they spend.
Moreover, it tells you the contents you need to tweak or pages to optimize for better conversion.
How To Increase Your Average Time On Page?
Here are some proven ways to improve your website’s average time on page:
- Use High-Quality Content
Your content is pivotal to how long users spend on your page. If you want users to stay longer on your website, you need to develop high-quality content that provides value to them.
- Include Call To Action In Your Copies
Call-to-action (CTA) buttons or text tell users what to do next on your site. They guide a visitor naturally from one point to the next in the conversion process.
CTA’s include a link to your product page, a form, a share button, etc.
Frequently Asked Questions About Google Analytics KPIs
Here are answers to some FAQs you might have about Google Analytics KPIs.
Are KPIs and metrics the same thing?
No. All KPIs are metrics, but not all metrics are KPIs. KPIs are metrics attached to a goal.
What is the most crucial metric in Google Analytics?
There is no one-size-fits-all answer to this question. The most crucial metric is relative to your website and goals.
But if we narrow down the metrics in Google Analytics to one, it is the bounce rate.
As previously stated, bounce rate provides information on how many users visit only one page before exiting your website.
Final Verdict
Google Analytics is the most popular analytics solution. Although it has many metrics and dimensions, key performance indicators (KPIs) give you crucial information about your website, its users, and their relationship.
In this article, we have discussed the five most important Google Analytics KPIs. They are bounce rate, goal conversion rate, new and returning users, landing pages, and average time on page.
So, when you get your Google Analytics report, pay close attention to it. Also, ensure that you set goals measurable with your web analytics data.
Lastly, the best Google Analytics alternative is Abralytics. It’s an analytics solution that can help track your website’s key performance indicators with so much ease.
If you found this info helpful, then check out these related articles:
- How to track button clicks on Google Analytics
- Universal Google Analytics versus Google Analytics 4 – What’s the Difference and Should I Switch Over?
- How often does Google Analytics update?